


5.4.2 Lecture Notes Importance of Model Fidelity of Energy Conversion Technologies
Course subject(s)
5. Multi-carrier Grid Integration

This image is from freepik.
This lecture will discuss the importance of modelling resolution in energy system analysis. This importance will be illustrated by two examples. The following topics will be covered:
- The importance of modelling of energy conversion techniques in power systems
- An example with power to gas electrolysers
- An example with heat pumps
The importance of modelling of energy conversion techniques
Technical analysis plays an important role in evaluating the adoption of technology. Errors due to incorrect of oversimplified model can lead to incorrect conclusions about the technology. Therefore, attention should be paid to the models and insights from this should be included in the analysis.
An example with power to gas electrolysers
Power to gas electrolysers can be used to support the grid frequency. In power system analysis studies, which evaluates the role of the electrolysers. The electrolyser is made up of smaller cells that conduct the electrolysis process. To measure the health of an electrolyser, the VI (Voltage-Current) curve is analysed before and after the operation.
For the cells of the electrolysers, two different models can be made. The first one will be a detailed model, whereas the second one will be a simple model. The detailed model includes equations concerning mass flow rates, thermal and electrical dynamics, and other aspects. This makes it possible to extract voltage and current information about individual cells. The simple model does not include any equations and uses a constant power load model. VI plots cannot be obtained from this model, and it assumes that any power setpoint can be reached by the electrolyser.
In the scenario, where the electrolyser is combined with a wind generator, the operator of the wind generator creates a schedule of the power generation of the next day to the grid operator. However, this can only be an estimate, since wind is unpredictable. To adhere to the schedule, the electrolyser is used to absorb excess power in overgeneration, and to lower its power in under-generation.
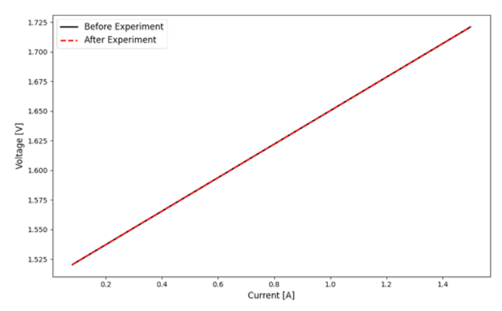
When the detailed model of the electrolyser is used, the VI curve of the electrolyser can be obtained before and after the operation. In the figures below, this is done for one day. It can be seen that both curves overlap, indicating that the electrolyser is in perfect health.
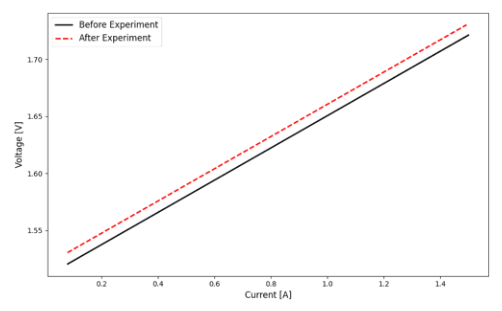
In the figure below, the same is done but then for a whole year. It can now be seen that the VI curve has slightly been shifted. This means that the cells have degraded over time and the efficiency of the cells has decreased. In this situation, the decrease in efficiency is 0.8%, which would result in a 4% decrease after 5 years. This type of information could not be retrieved from the simple model, and therefore more detailed models are important.
An example with heat pumps
Heat pumps are energy conversion devices that use electrical energy to transfer heat from a cold place to a warm place. The working principle of a heat pump can be understood from the figure below.
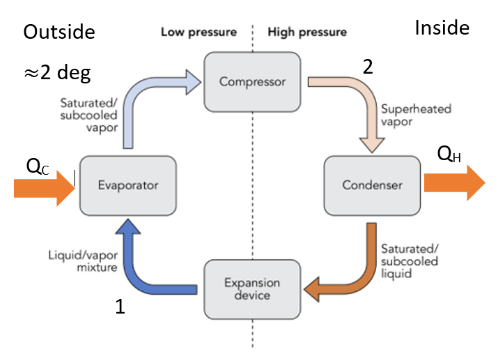
At point 1, the liquid is around 0 degrees when it flows outside. It is then heated by the outdoors environment, such that the temperature is raised. Then the electrical power compressor will increase the pressure of the liquid and therefore also the temperature. At point 2, the liquid is extremely hot and will give its heat to the indoor environment. After this, the pressure is released again and it will flow outside, repeating the process.
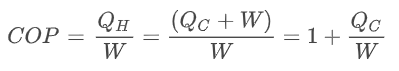
An important difference between a heat pump and a boiler/ resistive heater is that electrical power is used to transfer heat instead of generating heat. To measure the effectiveness of a heat pump, the coefficient of performance (COP) has been defined. It measures how effectively the heat is transferred and it is expressed as the ratio of the heat flowing inside (QH) over the electrical work (W):
The COP is a property of the heat pump, and it depends on the temperature difference between outside and inside (ΔT). In different studies it has been shown that it can be modelled with the following equation:
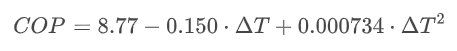
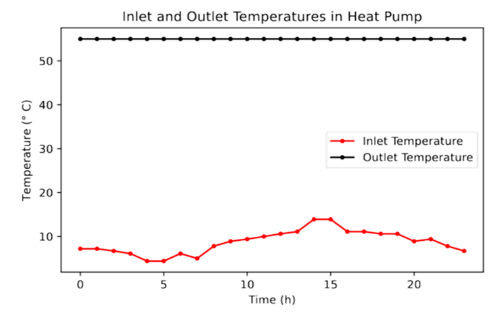
In this example, a heat pump is installed in San Francisco and the first day of January is simulated. The ambient temperature (shown in red) and the hot water requirement (shown in black) are shown in the figure below.
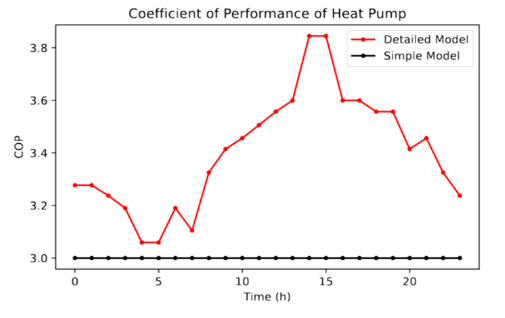
In the figure below, the COP is shown for two different models. The detailed model (shown in red) used the equation that was discussed above, and the simple model (shown in black) always has a COP of 3.
If the power thermal power demand is 100 kW, the required electrical power can be obtained by dividing 100 kW by the COP. The power consumption for both the detailed and simple model is shown in the figure below.
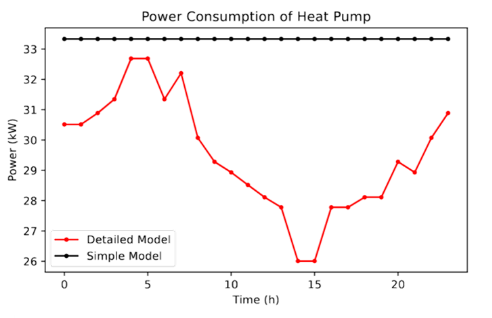
If it is assumed that the weather is the same in San Francisco as in the Netherlands, the price of the electricity can be calculated. If the analysis is done for 100 heat pumps, the total electricity cost for the simple model is €78000, and €69000 for the detailed model. This is the reason detailed models are preferred over simple models.
Conclusion
This lecture discusses the importance of the modelling resolution in energy systems. The difference between simple models and detailed models was shown by two examples. In the first example, two different models of an electrolysers were considered. It was shown that the simple model was not sufficient to observe the degradation. In the second example, the electricity costs for a heat pump were analysed. It was shown that there was a big difference between the simple and detailed model.

Technology of Intelligent and Integrated Energy Systems by TU Delft OpenCourseWare is licensed under a Creative Commons Attribution-NonCommercial-ShareAlike 4.0 International License.
Based on a work at https://online-learning.tudelft.nl/courses/technology-of-intelligent-and-integrated-energy-systems/