The Human Controller – Practical Assignment overview
Course subject(s)
01. General Introduction
02. From Perception … to Action
03. Design & Evaluation
04. Frequency Domain Analyses
05. Haptic Applications
06. Shared Control
07. General Discussion
The assignment for OpenCourseWare features the McRuer’s Crossover Model. The assignment usually is made in groups of 4 to 5 students. The groups of students must communicate the results in either short presentations, or written reports, which will be graded by the teacher and instructors. The assignment and the presentations with the result can be found below.
PA – McRuer’s Crossover Model
The Practical Assignment consists of two parts:
- Part 1 – McRuer
- Part 2 – Step Responses (Fitt”s Law)
For both the parts specific sofware and hardware need to be used.
Download the MMSlab2.21 file and unzip onto the hard drive of the PC. Start the program by clicking MMSlab2.exe. Use the mouse connected to the PC, and ensure that the settings are selected according to the instruction PDF “Mouse Properties Settings.pdf”.
This is to make sure that all participants have identical inputs to the MMSlab2 experiment. Everyone should have the same mouse input settings. This means the relation between the position of the mouse and the position of the cursor on the screen.
MMSLab2.21
Mouse Properties Settings
Learning Goals
After having performed the Practical Assignment, you will have gathered experimental data similar to earlier experiments by McRuer and by Fitt, and will be able to:
- Reproduce important factors to take into account when you lead an experiment (training, clear instructions), and when you are performing an experiment (concentration, serious effort).
- Reproduce how different system orders behave in time and frequency domain.
- Apply McRuer’s crossover model theory, and Fitt’s law, to explain experimentally found behavior.
- Critically reflect on the balance between performance and control effort, and inter and intra-‐ subject variability.
- Critically reflect on the benefits and limitations of using metrics and models.
Assessment
You will be required to make a PowerPoint presentation for each question. Use a maximum of two slides per question, to present your results and analyses. During the Present and Discuss the Practical Assignment lecture each group will randomly be selected to present several questions, in such a way that together we will have discussed each of these 18 questions. You will be graded by the supervisors on the presented questions during the lecture (correctness of results, presentation, ability to discuss and critically reflect on your own findings and those of others).
For OpenCourseWare we recommend to complete each question and compare the answers with the answers presented in the Present and Discuss the Practical Assignment lecture.
Tips & Tricks
- The settings for each of the tasks are pre-‐programmed, which you can load using the Open button. You can also manually change them, if you’d like to try out different settings for fun, but for the assignment, please use the pre-‐programmed tasks!
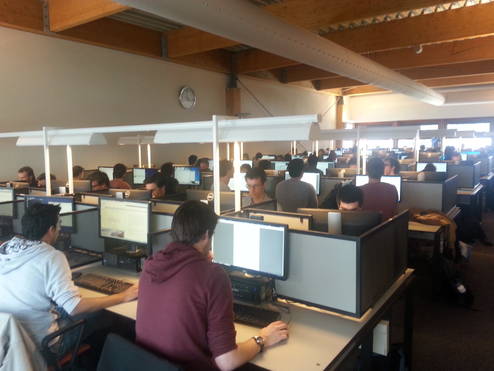
- Each group member has a computer available to do the experiments, make sure your group uses the available two hours to gather all the experimental data! In other words, let each group member perform each experiment simultaneously (not sequentially).
- You can start the tracking task by pressing the Run button. After the trial is finished, press the Save button to save your experiment. Please make sure to save the measured data after every repetition in a new .mms file (in a separate folder for each subject, to avoid confusion). This should be done in the main program window (MMSLab2) and not in the plot results section called MMSLab2Plotter (here you only save pictures from the results of a single trial). Make sure you give every file for each repetition and subject a new name. If you load the saved data, you can also replot the figures later on.
- The McRuer Crossover model and Fitts’ law assume that the human behaves like an optimal controller. Therefore, 2 training runs are mandatory for each task, before you start to do the ‘real’ measurements you will use to report your results.
- To ensure you can report both intra-‐individual and inter-‐individual variability, make sure that every group member is a participant in all tracking tasks (for an indication of inter-‐subject variability).and also that each participant repeats tasks for at least 4 times (for an indication of intra-‐subject variability).
- The metrics you should report are RMS Error and STD input , which can be found in the Output tab. FAQ and some tips for troubleshooting
- Note that we have had some complaints about software sometimes not functioning on some laptops. We have tried to get rid of as many bugs as possible in this version, but found out that sometimes problems can be remedied by adapting the screen resolution (please refer the PDF “Change Windows Default Fonts.pdf”).
- When viewing the PSD plots, an error window may pop up, but this can be ignored and the task can be continued.


The Human Controller by TU Delft OpenCourseWare is licensed under a Creative Commons Attribution-NonCommercial-ShareAlike 4.0 International License.
Based on a work at https://ocw.tudelft.nl/courses/the-human-controller/.


