


2.3 Calculation (with Python)
Course subject(s)
2. Improving the model
Python program for Euler’s Method
In the previous section Euler’s Method was introduced, and now you can approximate the solution of a differential equation. Of course calculations by hand are inefficient. The method is very suitable to implement in a computer program: much faster and probably more accurate. So in this section, you will use Python to simulate the same solutions.
You can download the basic code for Euler’s method here: Basic_Euler.py.
Run it, and see what it does!
Basic_Euler.py: header and initialisations
# Program : Euler's Method
# Author : MOOC team Mathematical Modelling Basics
# Created : April, 2017
import numpy as np
import matplotlib.pyplot as plt
print("Solution for dP/dt = 0.7*P")
Dt = 0.1 # timestep Delta t
P_init = 10 # initial population
t_init = 0 # initial time
t_end = 5 # stopping time
n_steps = int(round((t_end-t_init)/Dt)) # total number of timesteps
P_arr = np.zeros(n_steps + 1) # create an array of zeros for P
t_arr = np.zeros(n_steps + 1) # create an array of zeros for t
t_arr[0] = t_init # add the initial t to the array
P_arr[0] = P_init # add the initial P to the array
Basic_Euler.py: Iterations Euler’s Method
for i in range (1, n_steps + 1):
P = P_arr[i-1]
t = t_arr[i-1]
dPdt = 0.7*P # calculate the derivative
P_arr[i] = P + Dt*dPdt # calculate P on the next time step
t_arr[i] = t + Dt # adding the new t-value to the list
Basic_Euler.py: Plotting the results
fig = plt.figure() # create figure
plt.plot(t_arr, P_arr, linewidth = 4) # plot population vs. time
plt.title('dP/dt = 0.7P, P(0)=10', fontsize = 25)
plt.xlabel('t (in days)', fontsize = 20)
plt.ylabel('P(t)', fontsize = 20)
plt.xticks(fontsize = 15)
plt.yticks(fontsize = 15)
plt.grid(True) # show grid
plt.axis([0, 5, 0, 200]) # define the axes
plt.show() # show the plot
# save the figure as .jpg
fig.savefig('Rainbowfish.jpg', dpi=fig.dpi, bbox_inches = "tight")
As you have seen in the previous section, a large time step of 7 days leads to results that are not valid for the rainbowfish population. In the next video you will see what happens when the stepsize is reduced.
Euler's method
Sorry, there don't seem to be any downloads..
Subtitles (captions) in other languages than provided can be viewed at YouTube. Select your language in the CC-button of YouTube.
In the video you have seen that a step size of 1 day is not too large to obtain reasonable results. Now it is time for you to do some programming yourself.
Our problem:
Find teq such that P(teq)=720, when
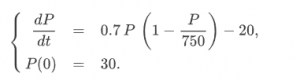
t_arr[21] and P_arr[21]. Alternatively, you can put print statements in your program and run it (again).
Mathematical Modeling Basics by TU Delft OpenCourseWare is licensed under a Creative Commons Attribution-NonCommercial-ShareAlike 4.0 International License.
Based on a work at https://online-learning.tudelft.nl/courses/mathematical-modeling-basics/.