


2.3 Calculation (accuracy)
Course subject(s)
2. Improving the model
Calculation (accuracy)
Now you have working code, it is time to investigate the stepsize further.
In the next figure you can see the approximate solutions for Δt=1, Δt=12 and Δt=14 day. As you can see the graphs of the biggest two stepsizes differ more than the graphs of the two smallest stepsizes. This behavior is called numerical convergence: The smaller you take Δt, the better your approximation becomes and it will look more and more like the exact solution.
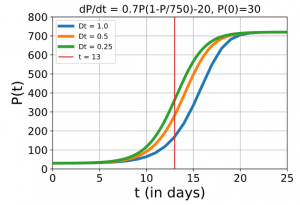
In the figure you can also see that the largest differences in the value of P occur around 13 days:

So when you want to know the number of fish at 13 days, the stepsize is very important. The difference between Δt=1 day and Δt=0.5 day is more than 112 fish! And between the two smaller stepsizes, the difference is still more than 81 fish. So the results clearly change a lot, when the stepsize is halved.
Error of an approximation with Euler’s method
We will not give any theoretical background here for the estimation of the error of a result with Euler’s method. That would go too far for this course. So, without any proof:

So an estimate of the error in the result with Δt=0.5 is 281.64−169.24=112.40 fish. And an estimate of the error in the result for Δt=0.25 is 81.45 fish.

Mathematical Modeling Basics by TU Delft OpenCourseWare is licensed under a Creative Commons Attribution-NonCommercial-ShareAlike 4.0 International License.
Based on a work at https://online-learning.tudelft.nl/courses/mathematical-modeling-basics/.