


2.4 Validation
Course subject(s)
2. Improving the model
Validation
In this section you have found that the model dX/dt=kX(1−X) with k=0.25 can describe the two historical datapoints in this story: X(0)=0.02and X(20)=0.75.
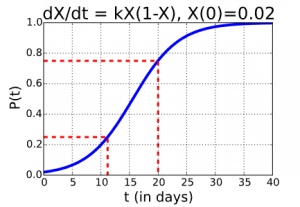
So now you can tell your teacher that you have a model for the epidemic. The red lines in the graph indicate X(11)≈0.25 and X(20)=0.75. You could summarize this epidemic by saying that it probably had three phases of approximately 10 days each. The first and the third phases were relatively slow: a quarter of the people got infected. The second phase was fast: half of the population got infected.
In searching for the right value for k, you have experienced the sensitivity of the results to parameter k. You could also consider the reverse: what happens with your k-value, when one of the two datapoints used is a little off, for example because of a measurement error. A model fitted to just two datapoints is probably not very robust in that sense. On the next page, we would like you to think further about what you could do when you have more datapoints.

Mathematical Modeling Basics by TU Delft OpenCourseWare is licensed under a Creative Commons Attribution-NonCommercial-ShareAlike 4.0 International License.
Based on a work at https://online-learning.tudelft.nl/courses/mathematical-modeling-basics/.