


1.2.2 Summary
Course subject(s)
1. Introduction to Observation Theory
Quality and Types of Errors
Distribution of random errors
In absence of systematic biases and outliers, the individual random errors are the deviations of repeated measurements from their mean:
\[ e_i = y_i -\bar{y}\]
where \(e_i\) is the error in the \(i\)th measurement.
Random errors are usually assumed to have a normal distribution. Since on average the random errors are zero, the expection \(E\{\underline{e}\}=\bar{e}=0\). We thus have:
\[ \underline{e} \sim N(0,\sigma^2_e)\]
The variance is the measure for the spread in the outcomes of the random errors, and therefore for the precision of the measurements. The sample variance of the random errors can be determined based on a large number \(m\) of repeated measurements:
\[\begin{align}\sigma_e^2 &= \frac{1}{m-1} \sum_{i=1}^{m} (e_i - \bar{e})^2\\ &= \frac{1}{m-1}\sum_{i=1}^{m} (y_i - \bar{y})^2 = \sigma^2_y\end{align}\]
The second equality follows from plugging in \(e_i = y_i -\bar{y}\) and \(\bar{e}=0\). It thus follows that \(\sigma_e^2 =\sigma^2_y \).
The precision of a measurement can be determined based on a calibration campaign: repeat the measurement of a known quantity many times and calculate the sample variance.
Covariance and correlation
Assume now that multiple measurements \(\underline{y}_i\) are collected with the purpose to estimate the unknown parameters of interest, and for each measurement the precision \(\sigma_{i}\) is a priori known based on a calibration campaign. Note that each measurement may have a different precision. For instance if the measurements are made with different instruments.
The covariance of two measurements \(i\) and \(j\) is given by:
\[\begin{align} \sigma_{ij} &= E\{(\underline{y}_i-\bar{y}_i)(\underline{y}_j-\bar{y}_j)\}\\& =\rho_{ij} \sigma_{i} \sigma_{j}\end{align}\]
where \(\rho_{ij} \) is the correlation coefficient.
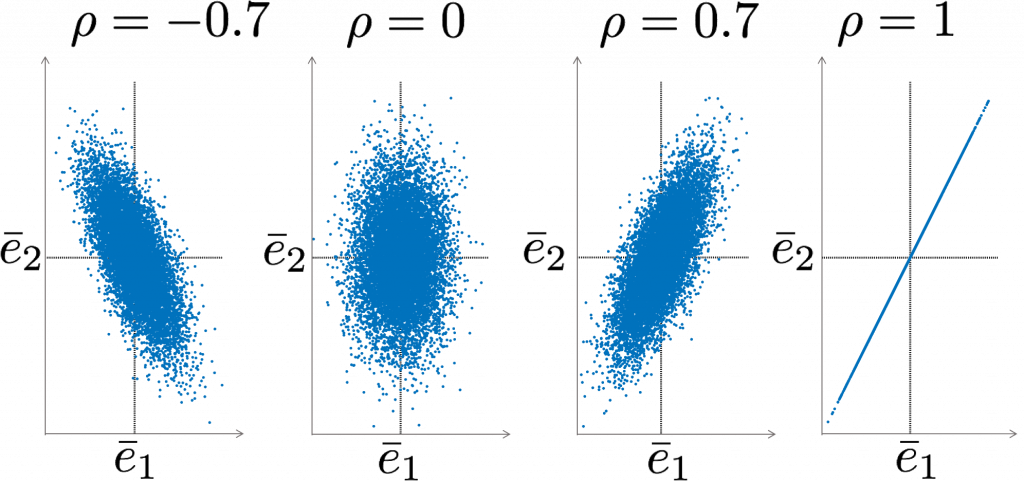
The correlation coefficient by definition takes a value between -1 and 1, and is a measure of the dependence of two random variables. If \(\rho_{ij} =0\) the random variable are uncorrelated and thus independent. If \(\rho_{ij}= \pm 1\) the variables are fully correlated: knowing the value of one variable, means that the value of the other variable is also known – the two variables have a linear relation. A positive correlation coefficient means that if one variable increases, the other one tends to increase as well; conversely a negative correlation means that an increase of one variable is accompanied by a tendency of the other variable to decrease.
Examples are shown in the figure, for an example with a large number of repeated measurements; for this example \( \sigma_1=1\) and \( \sigma_2=2\). the larger standard deviation of the second measurement results in a larger spread in the vertical direction. Obviously, the measurements fluctuate around the means.
Covariance matrix
When taking \(m\) measurements, the measurements vector is \(\underline{y}= [\begin{array}{llll} \underline{y}_1 & \underline{y}_2 & \ldots & \underline{y}_m \end{array}]^T\)
The corresponding vector with random errors is \(\underline{e}= [\begin{array}{llll} \underline{e}_1 & \underline{e}_2 & \ldots & \underline{e}_m \end{array}]^T\).
The covariance matrix \(Q_{ee}\) of vector \(\underline{e} \) is defined as:
\[Q_{ee}= Q_{yy} = \left[\begin{array}{llll} \sigma^2_1 & \sigma_{12} & \ldots & \sigma_{1m} \\ \sigma_{12}& \sigma_{2}^2 & \ldots & \sigma_{2m} \\\vdots & \vdots & \ddots & \vdots \\ \sigma_{1m} & \sigma_{2m} & \ldots & \sigma_{m}^2 \end{array}\right]\]
Note that the covariance matrix is symmetric, since \(\sigma_{ij} = \sigma_{ji} \). If all measurements are independent, all covariances will be equal to zero, and the covariance matrix becomes a diagonal matrix with the variances on the diagonal.
Multivariate normal distribution
The random errors, and thus also the measurements, are assumed to be normally distributed. For the random vectors \(\underline{e} \) and \(\underline{y} \) this means that the multivariate normal distribution must be considered.
Notation: \(\underline{e} \sim N(0,Q_{yy}) \) with \(0\) an \(m\)-vector with zeros; \(\underline{y} \sim N(\bar{y},Q_{yy}) \).
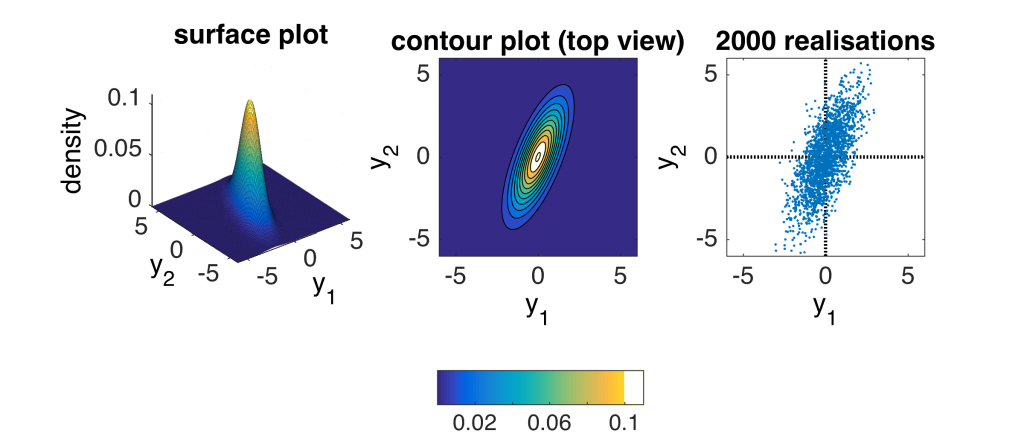
The normal PDF of \(\underline{y}\) is given by:
\[f_{\underline{y}} (y) = \frac{1}{\sqrt{\det(2\pi Q_{yy})}} \exp(-\frac{1}{2}(y-\bar{y})^T Q_{yy}^{-1}(y-\bar{y}) )\]
An example of the bivariate normal PDF is shown in the figure; in this example \( \sigma_1=1\), \( \sigma_2=2\) and \(\rho_{12}=0.7\).

Observation Theory: Estimating the Unknown by TU Delft OpenCourseWare is licensed under a Creative Commons Attribution-NonCommercial-ShareAlike 4.0 International License.
Based on a work at https://ocw.tudelft.nl/courses/observation-theory-estimating-unknown.