


5.6.2 Lecture Notes Future energy systems towards 2050
Course subject(s)
5. Multi-carrier Grid Integration
This image is from freepik.
This lecture will discuss the future energy systems towards 2050 from an industry perspective. In particular, the perspective will be from a Distribution System Operator (DSO). The following topics will be covered:
- The different scenarios towards a zero-emission goal
- The energy transition model
- The impact of the scenarios
The different scenarios towards a zero-emission goal
To achieve a zero-emission energy system, different scenarios are investigated. The first scenario is the regional scenario. In this scenario, the region has many heat networks, and it focusses on local renewable sources, such that they become self-sufficient. In this scenario, citizens are very driven.
Another scenario is the national scenario. A county becomes the leader in reducing CO2 emissions. Also, the county’s focus is geared towards the overall renewable sources.
The third scenario is the European scenario. In this scenario, Europe becomes the leader in reducing the CO2 emissions and the focus is on importing biogas. The energy-intensive industry is growing in this scenario.
The last scenario is the international scenario. For this scenario, the entire world aims to reduce the CO2 emissions. There is a global market for hydrogen and biomass, and the focus is the import of hydrogen. These four scenarios create a scenario space of different directions under the condition of zero emission in 2050.
The energy transition model
From the scenarios, an Energy Transition Model (ETM) has been created. The ETM makes energy calculations that include electricity, hydrogen, biogas, and heat. After this, the hourly profiles for demand and supply are regionalised. At a regional and national level, conversion, storage and exchange is included.
After the regionalisation, the local supply and demand are calculated in the existing network for both the TSO and DSOs. At this point, possible issues can be found, such as the lack of capacity or the need for a new analysis. After this, the analysis provides measures or adjustments for the energy system. Finally, the model comes up with the developing path in the near future.
The analysis shows that in the four scenarios there is a significant difference between the demand and supply. The supply comes party from renewables, which is a weather dependent energy source. The difference between the supply and demand is called the flexibility plot, as it shows where the flexibility options should fill the gap. If there is more demand than supply, this is an energy shortage. If there is more supply than demand, there is an energy surplus.
Examples of the flexibility options are:
- Electrical interconnection
- System batteries
- Power plants
- Power-to-gas
- Gas storage
- Curtailment
The peak power of the exchange and conversion of each of these flexilbe options is shown in the figure below.
Peak power of exchange and conversion
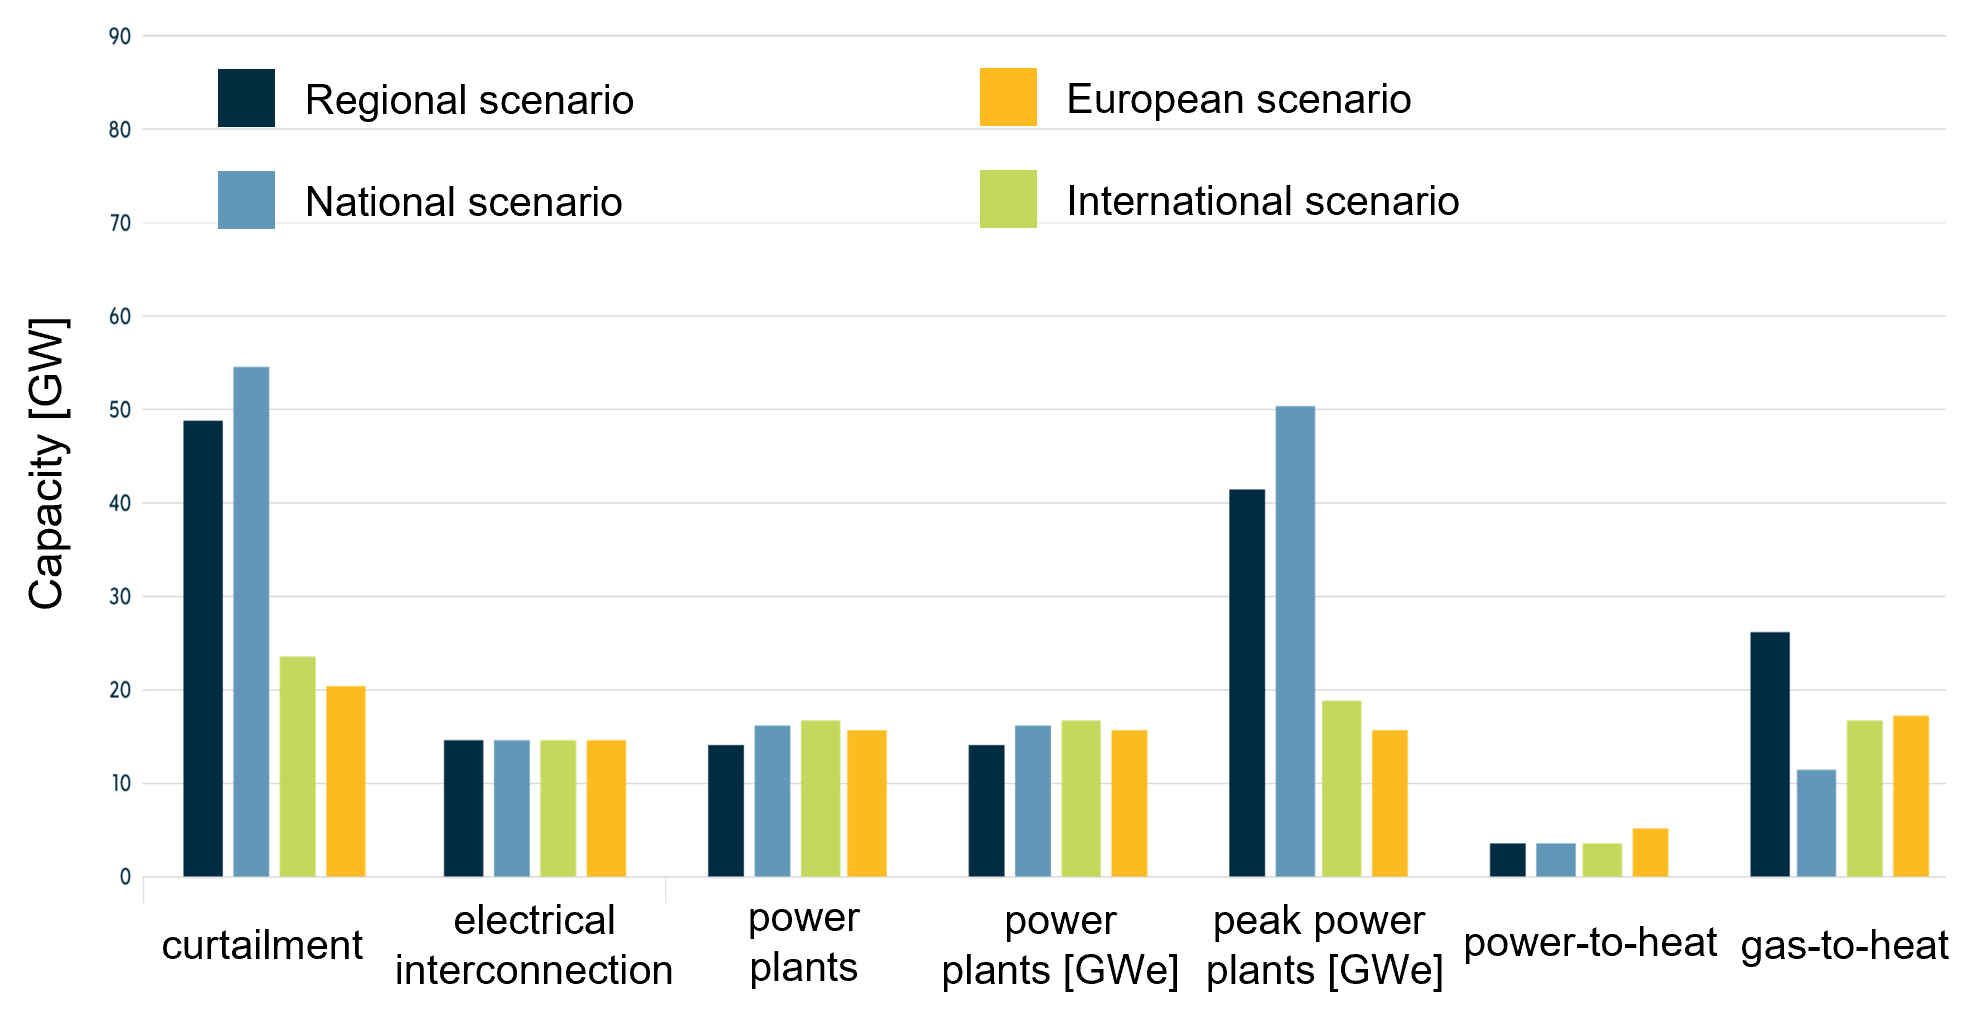
From these different options, power-to-gas and gas storage are multi-energy systems. Those are important, since they are the key for overcoming the renewable fluctuations.
The next step for the model is to identify where the chosen flexibility options should be located. After this, new bottlenecks in connection points for the TSO and DSO’s can be found, such that the solution is found in a timely manner. Examples of these solutions are:
- Couling stations
- Increase in sustainable generation
- Timely deployment of flexibility
Finally, the developed pathways are generated for every scenario. The model indicates what capacity of each flexibility options must be installed such that the zero-emission goal is reached.
The impact of the scenarios
The different scenarios have a significant impact on the cost and space of the energy system. This impact on the cost can be seen in the figure below. On the left, the current cost of the energy system is shown, and the other bars represent the costs for different scenarios.

The different scenarios also have an impact on the space in the Netherlands. For the regional and international scenario, more solar parcs and wind farms need to be installed in different parts of the country, whereas for the European and international scenario, there is more focus on the hydrogen and gas infrastructure that needs to be installed.
Conclusion
This lecture discussed the future of the energy transition from an industry perspective. First, four scenarios were identified, which were: regional, national, European, and international. After this, the energy transition model was discussed, and finally the impact on the cost and space were analysed.

Technology of Intelligent and Integrated Energy Systems by TU Delft OpenCourseWare is licensed under a Creative Commons Attribution-NonCommercial-ShareAlike 4.0 International License.
Based on a work at https://online-learning.tudelft.nl/courses/technology-of-intelligent-and-integrated-energy-systems/