


Food for thought: BLUE
Course subject(s)
4. Best Linear Unbiased Estimation (BLUE)
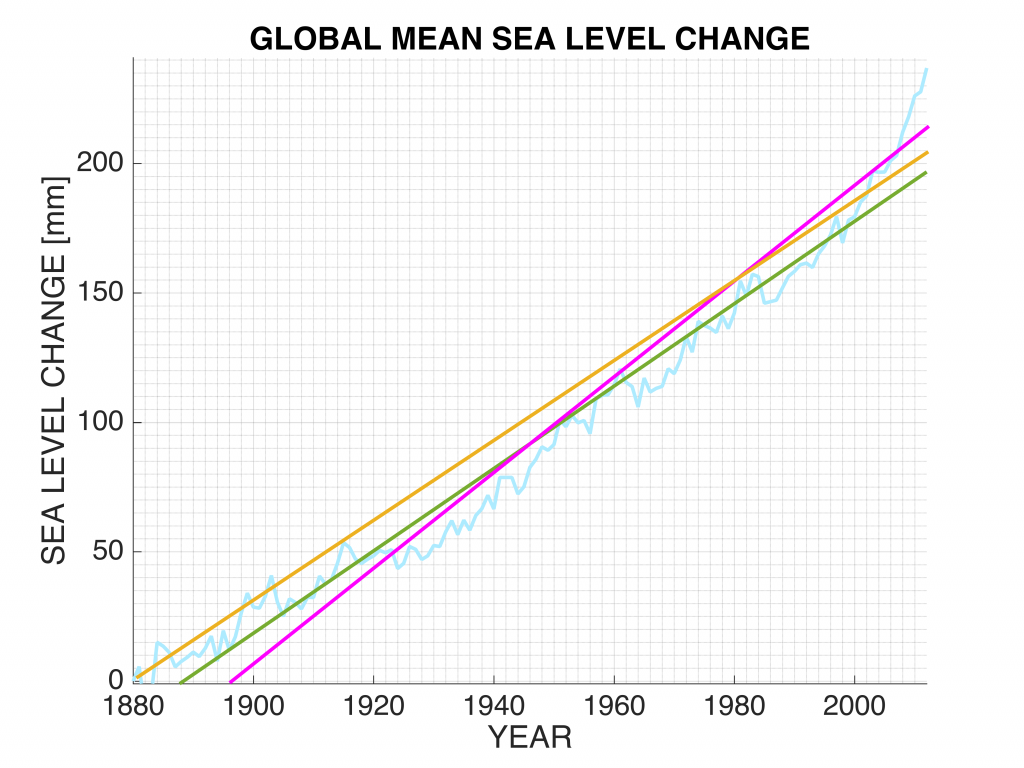
Let’s look again at the sea level rise problem. The figure shows the record of sea level observations (light blue) based on tide gauge observations (and together with 3 ‘fitted’ lines to model the sea level rise as a linear trend).
In the last module, we discussed how to choose the optimal line based on the criterion of minimizing the differences between the observations and the fitted model. However, some the observations may have better quality (or better precision) than others. For example, the recent data acquired by more recent technologies may be more precise than the data from 100 years ago. Then we need to assign different weights to the observations. With the concept of weighted least squares, we could assign more weight to a technique with a better precision.
Food for thought questions to you:
- How do we determine how much weight we should use for each observation?
- Which parameter in the least squares estimation method can be used to insert quality metrics to the problem?
- Is there some kind of ‘stochastic optimality criterion’, in other words, if we have different solutions, how do we know which one is the best in the stochastic sense?
At this stage, it is good to already consider these questions, and decide, intuitively, what your answers would be. In this module we will address these questions, so at the end of the module, you should be able to answer them.

Observation Theory: Estimating the Unknown by TU Delft OpenCourseWare is licensed under a Creative Commons Attribution-NonCommercial-ShareAlike 4.0 International License.
Based on a work at https://ocw.tudelft.nl/courses/observation-theory-estimating-unknown.