


Food for Thought: does it make sense?
Course subject(s)
6. Does the estimate make sense?
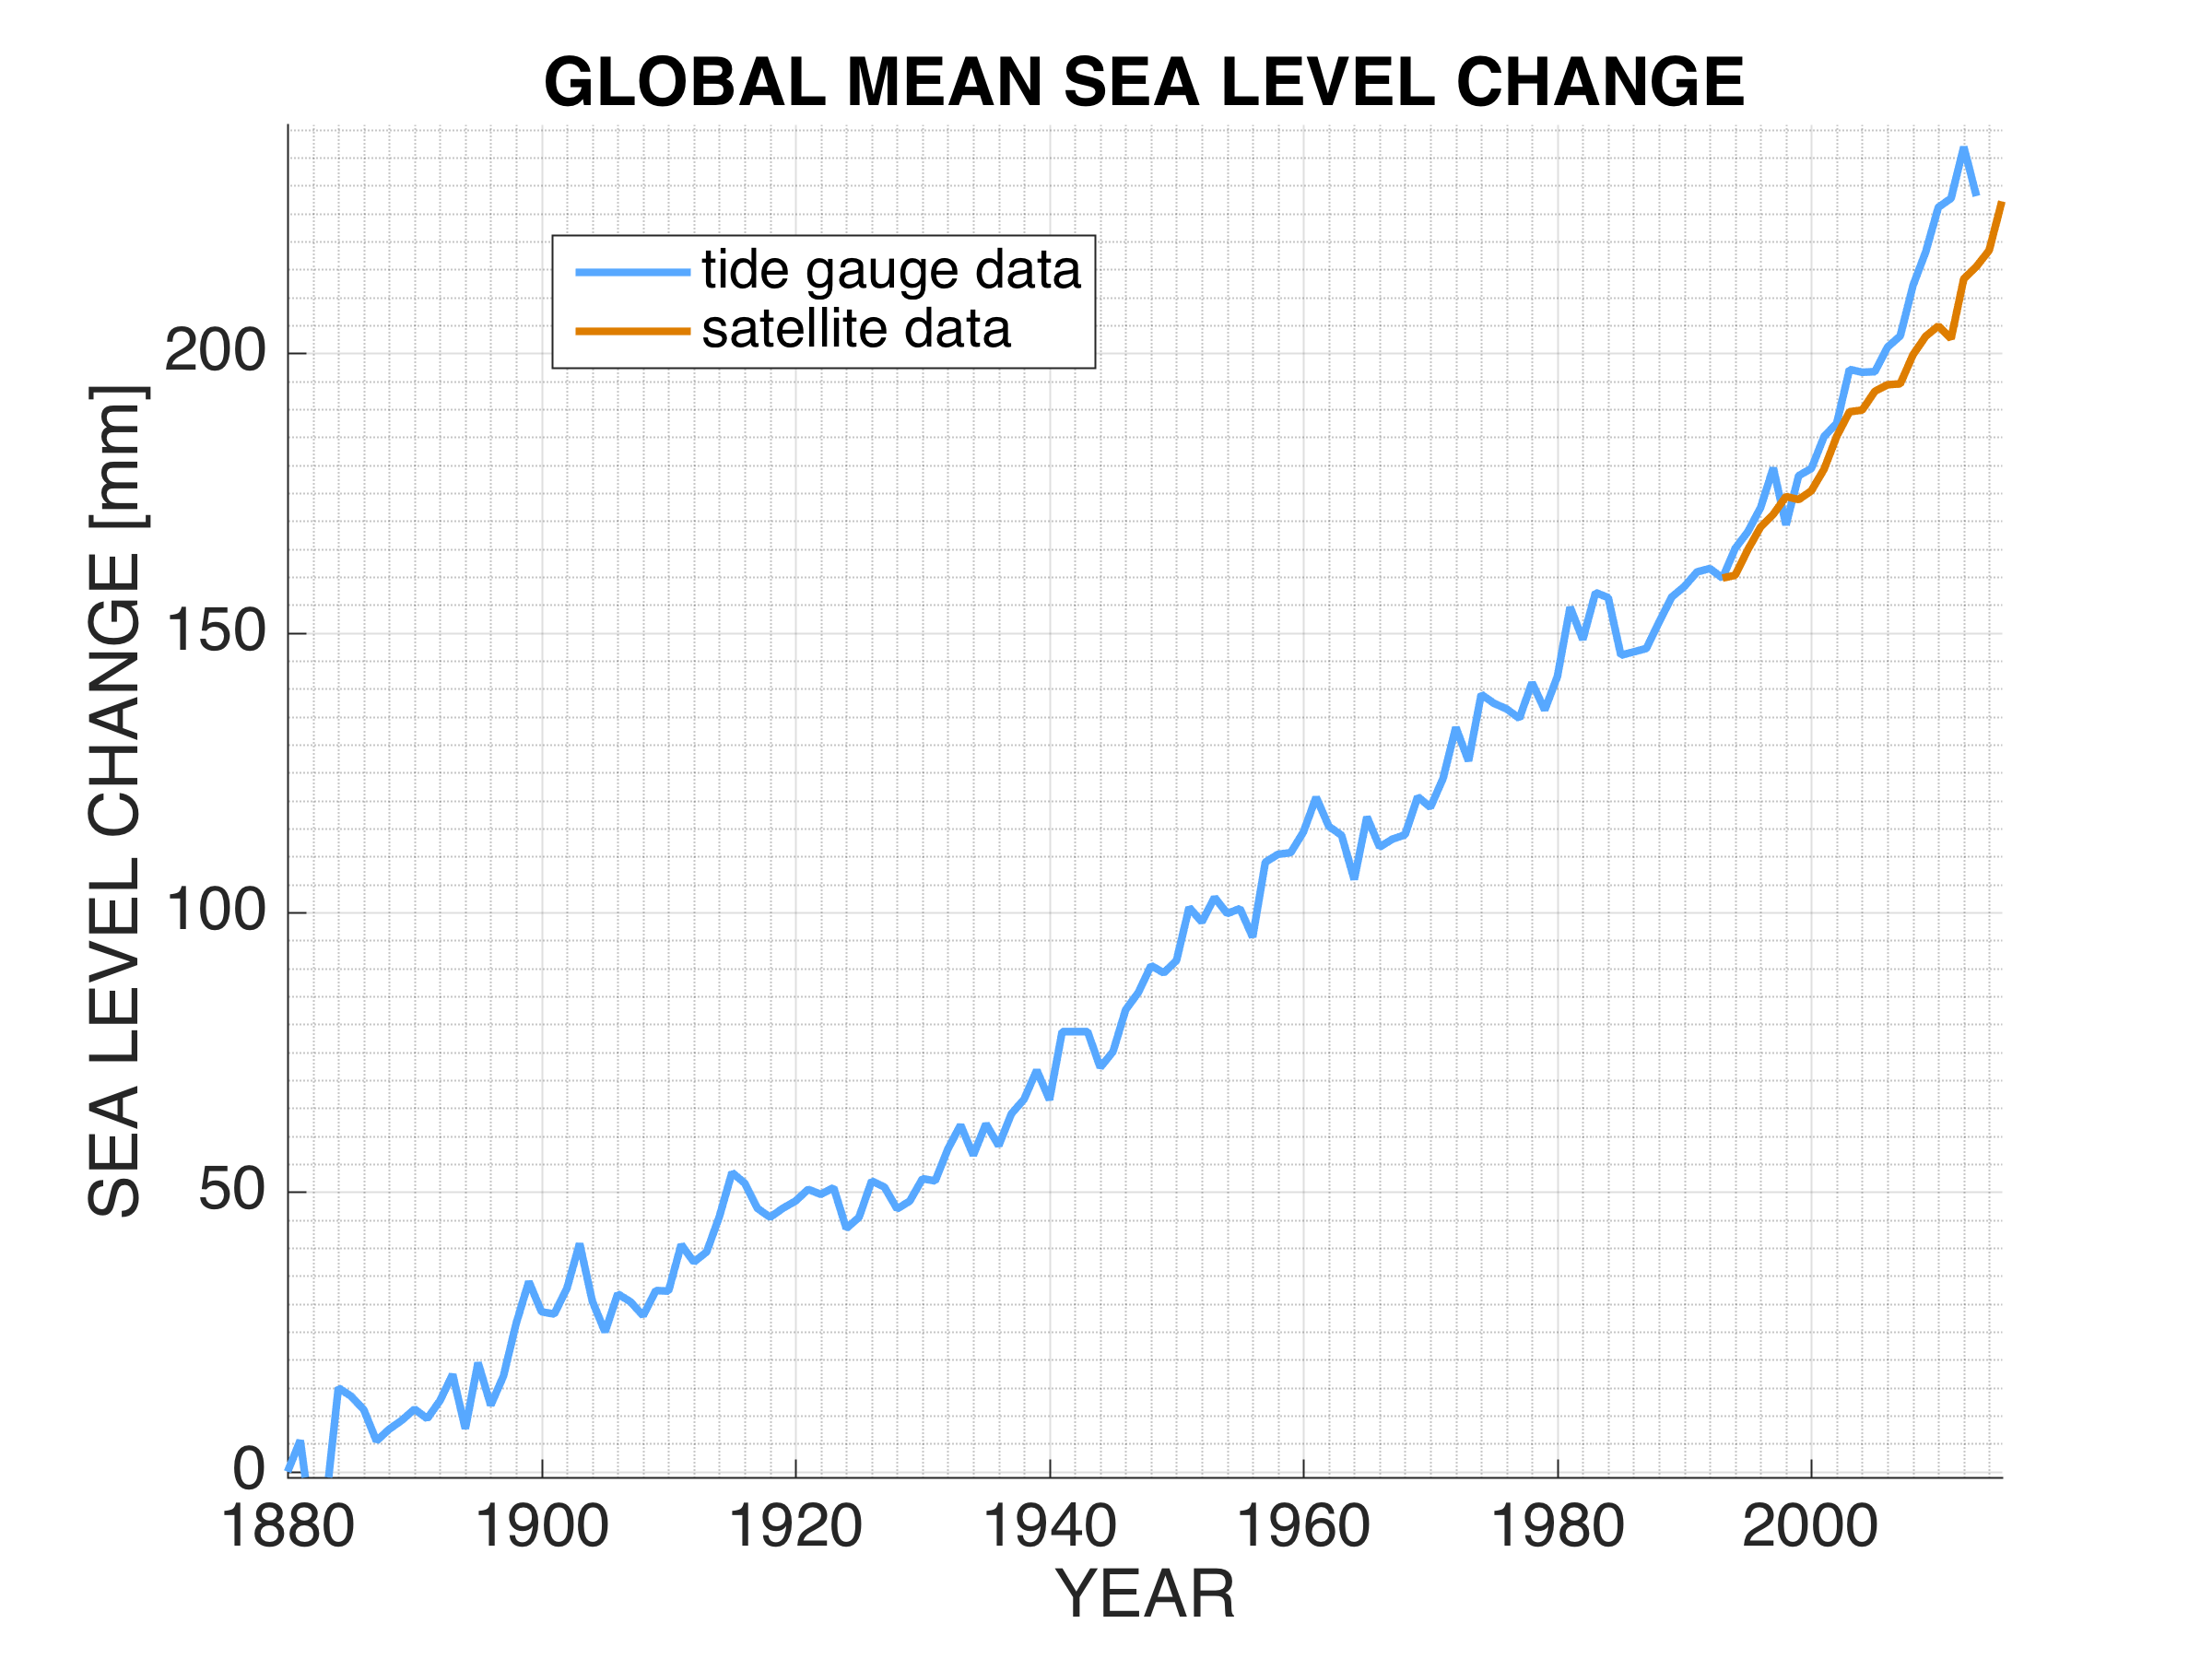
In the second module of this course, we started the discussion on the construction of mathematical models by the example of the sea level observations. We watched a video and discussed the importance of taking sea level observations to monitor the global mean sea level change. The figure below shows the sea level record based on tide gauge stations all over the world. In addition, you can see the satellite-based results, which are available only for the last 23 years.
In the remainder of this course, we discussed how to estimate the unknown parameters of an assumed functional model, how to account for the data uncertainty via a stochastic model, and how to describe and interpret the precision of the results. Now, it is time to think about general validity of the results. Everything that we discussed during the last modules was based on the assumption that the assumed mathematical model (including the both functional and stochastic models) is correct. However what would happen if the model was wrong? How can we test the general validity of our assumed model?
Questions for you to think about, before continuing with this module:
- We learned how to estimate the linear trend plus some periodic/annual signal based on the sea level data. However, can a simple linear+periodic trend explain the data sufficiently?
- From the results of BLU or WLS estimation, which parameter(s) can we use to test the validity of our assumptions in the mathematical model?
- What would happen if we have big outliers or gross-errors in the data? These errors are not explained by the functional model neither by the stochastic model. What would be the effect of having outliers on the final results of an estimation?
- What will be the effect of assuming a too optimistic/pessimistic stochastic model on the obtained precision of the results?
Try to answer these questions, but don’t worry if you can’t. The video’s and activities in this module will help you to find the answers.
The data used for the graph were obtained from the website of the US Environmental Protection Agency. The data sources they used are the absolute sea level trends provided by Australia’s Commonwealth Scientific and Industrial Research Organisation and the National Oceanic and Atmospheric Administration. These data are based on measurements collected by satellites and tide gauges.

Observation Theory: Estimating the Unknown by TU Delft OpenCourseWare is licensed under a Creative Commons Attribution-NonCommercial-ShareAlike 4.0 International License.
Based on a work at https://ocw.tudelft.nl/courses/observation-theory-estimating-unknown.