


Food for thought: sea level rise
Course subject(s)
2. Mathematical model
In the video the importance of taking sea level observations was explained. The figure below shows the record of global mean sea level based on tide gauge stations all over the world. In addition, you can see the satellite-based results, which are available only for the last 23 years.
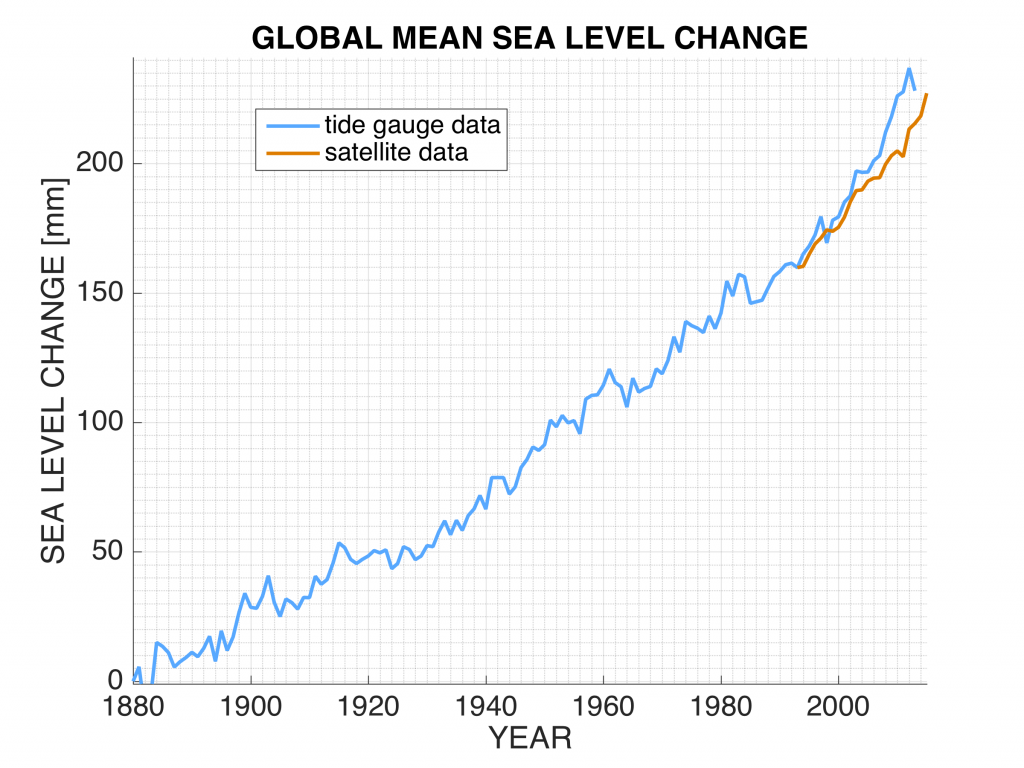
From this figure it is clear that sea level is rising. The goal is now to “model” the sea level rise, since based on such a model we can make predictions.
Questions for you to think about, before continuing with this module:
- What kind of mathematical model would you try to fit to the data set based on the tide gauge observations (e.g. straight line, exponential function, …)? And what are then the corresponding unknown parameters?
- Will it be possible to solve the corresponding estimation problem? In other words: how to estimate the unknown parameters from the observations?
- How to deal with the different precisions of tide gauge and satellite observations?
Try to answer these questions, but don’t worry if you can’t. The video’s and activities in this module will help you to find the answers and we will review the questions at the end of the module.
The data used for the graph were obtained from the website of the US Environmental Protection Agency. The data sources they used are the absolute sea level trends provided by Australia’s Commonwealth Scientific and Industrial Research Organisation and the National Oceanic and Atmospheric Administration. These data are based on measurements collected by satellites and tide gauges.

Observation Theory: Estimating the Unknown by TU Delft OpenCourseWare is licensed under a Creative Commons Attribution-NonCommercial-ShareAlike 4.0 International License.
Based on a work at https://ocw.tudelft.nl/courses/observation-theory-estimating-unknown.