


2.1.1 Whose assessments are more valuable?
Course subject(s)
Module 2. Calibration and Information score
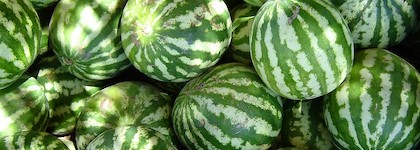 “Watermelons” by Ahmad is licensed under CC BY-NC 2.0
What is the percentage of water in watermelon?
To answer this question, we consult two experts (expert A & expert B). Each expert gives their 5%, 50% and 95% quantiles which can be seen in the table below.
| Expert | 5% | 50% | 95% |
|---|---|---|---|
| Expert A | 80 | 90 | 94 |
| Expert B | 93 | 95 | 97 |
Recall that, with their assessments, the experts are sending the following message:
Expert A:
– the median (50% quantile) estimate is 90, so (s)he believes that 90% is the best estimate for the percent of water in the watermelon. (S)he believes there is a 50% chance that the true water percentage is below or above 90.
– the lower bound (5% quantile) is 80, the is, (s)he believes there is a 5% chance that the true water percentage is below 80%.
– the upper bound (95%) is 94 the is, (s)he believes there is a 5% chance that the true water percentage is above 94%.
Concluding, according to expert A assessments, her/his best estimate is 90% and her/his uncertainty is given by the credible interval (80%,94%), that is, (s)he believes there is 90% chance that the true water percentage is between 80% and 94%.
Expert B:
– the median (50% quantile) estimate is 95, so (s)he believes that 95% is the best estimate for the percent of water in the watermelon. (S)he believes there is a 50% chance that the true water percentage is below or above 95.
– the lower bound (5% quantile) is 93, the is, (s)he believes there is a 5% chance that the true water percentage is below 93%.
– the upper bound (95%) is 97 the is, (s)he believes there is a 5% chance that the true water percentage is above 97%.
Concluding, according to expert B assessments, her/his best estimate is 95% and her/his uncertainty is given by the credible interval (93%,97%), that is, (s)he believes there is 90% chance that the true water percentage is between 93% and 97%.
What is the percentage of water in watermelon? We now know that the true value is 92%!

Decision Making Under Uncertainty: Introduction to Structured Expert Judgment by TU Delft OpenCourseWare is licensed under a Creative Commons Attribution-NonCommercial-ShareAlike 4.0 International License.
Based on a work at https://online-learning.tudelft.nl/courses/decision-making-under-uncertainty-introduction-to-structured-expert-judgment//.