


2.5.1 How to construct experts’ distributions
Course subject(s)
Module 2. Calibration and Information score
Within the Classical Model, the experts assess their uncertainty about an unknown quantity, which is modeled as a random variable. Instead of providing the entire distribution function, the experts need to provide 3 quantiles, the 5%, 50% and the 95% quantiles.
From the three quantiles, we need to construct the distribution function which corresponds to expert’s assessment. The next video will show you how experts’ distributions are constructed within the Classical Model.
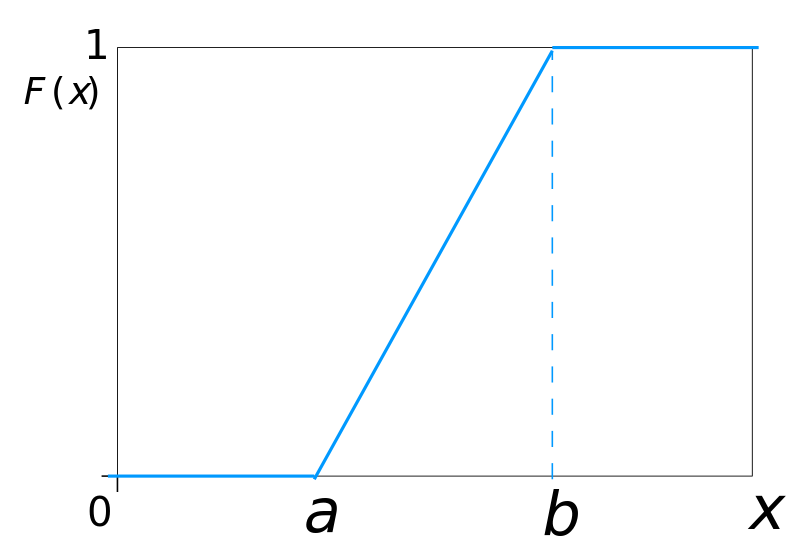
Before that, recall that the distribution function can either be specified using a cumulative distribution function (cdf). The cumulative distribution function of a random variable X is denoted by F(x), and is given by F(x)=P(X<=x). As an example, here is the cumulative distribution function (cdf) of a uniform random variable, defined on an interval [a,b], for any real-valued a and b, with a<b.
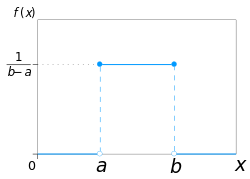
Alternative, the probability density function (pdf) can be specified, for a continuous random variable X. As a example, here is the pdf of a uniform random variable X is
How to construct the distributions of experts
Minimally informative and non-parametric distribution
This type of construction of the distribution is called minimally informative because it does not add any information other than the three quantiles.
To understand this better, let’s take as an example Expert’s 1 assessments for Question 1 in the Dutch eating habits example. The assessments are 10 (5% quantile), 40 (50% quantile) and 65 (95% quantile). With these assessments, the experts states the beliefs that
(1) there is a 5% chance that the true value is smaller than 10
(2) there is a 45% chance that the true value is between 10 and 40
(3) there is a 45% chance that the true value is between 40 and 65 and
(4) there is a 5% chance that the true value is larger than 65
From statement (2), it does not follow that certain values between 10 and 40 are more likely and other less likely. This kind of information is not elicited from the experts. That is why it is assumed that any value between 10 and 40 is equally likely. Similarly, any value between 40 and 65 is also equally likely. This leads to the plateau parts in the probability density functions of the experts.
This assumption thus adds minimum information to the experts’ assessments, and that is why the obtained distribution is called minimally informative.
The distribution is also non-parametric, since no parametric family (normal, exponential, Pareto, etc.) is assumed.

Decision Making Under Uncertainty: Introduction to Structured Expert Judgment by TU Delft OpenCourseWare is licensed under a Creative Commons Attribution-NonCommercial-ShareAlike 4.0 International License.
Based on a work at https://online-learning.tudelft.nl/courses/decision-making-under-uncertainty-introduction-to-structured-expert-judgment//.