


Week.2 Essence of Technology / Subscenario writing
Q Factor Analysis
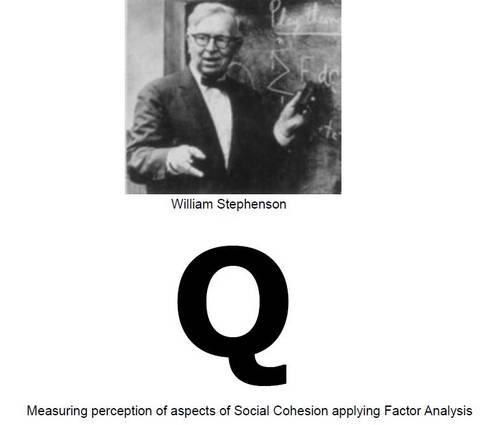
Q methodology provides a foundation for the systematic study of subjectivity, a person’s viewpoint, opinion, beliefs, attitude, and the like (Brown 1993). Typically, in a Q methodological study people are presented with a sample of statements about some topic, called the Q-set. Respondents, called the P-set, are asked to rank-order the statements from their individual point of view, according to some preference, judgement or feeling about them, mostly using a quasinormal distribution. By Q sorting people give their subjective meaning to the statements, and by doing so reveal their subjective viewpoint (Smith 2001) or personal profile (Brouwer 1999). Fig. 10 Laying the Q sort These individual rankings (or viewpoints) are then subject to factor analysis. Stephenson (1935) presented Q methodology as an inversion of conventional factor analysis in the sense that Q correlates persons instead of tests;
“[w]hereas previously a large number of people were given a small number of tests, now we give a small number of people a large number of test-items”. Correlation between personal profiles then indicates similar viewpoints, or segments of subjectivity which exist (Brown 1993). By correlating people, Q factor analysis gives information about similarities and differences in viewpoint on a particular subject. If each individual would have her/his own specific likes and dislikes, Stephenson (1935) argued, their profiles will not correlate; if, however, significant clusters of correlations exist, they could be factorised, described as common viewpoints (or tastes, preferences, dominant accounts, typologies, et cetera), and individuals could be measured with respect to them.
‘Concourse’
Statements forming the Q sort are selected from the so called ‘Concourse’: a collection of perceptions, opinions, expressions and so on associated with a certain topic. In this case: Social Cohesion. The concourse can be collected from:
1. Newspapers, magazins, TV, observations, interviews and son on, or constructed from:
2. Theory available on the topic. The concourse and the Q sort statements for the SC-Design course have been generated from the three dimensions of Social Cohesion theory, Sense of Belonging, Face to Face contacts, and Social Capital. For each of the three dimensions 8 statements have been formulated (see under).

Factor Analysis / Theory Outline
For further study material for Factor Analysis theory see references under.
Factor analysis is a statistical method used to describe variability among observed variables in terms of a potentially lower number of unobserved variables called factors. In other words, it is possible, for example, that variations in three or four observed variables mainly reflect the variations in a single unobserved variable, or in a reduced number of unobserved variables. Factor analysis searches for such joint variations in response to unobserved latent The factors resulting from Q analysis thus represent clusters of subjectivity that are operant, i.e., that represent functional rather than merely logical distinctions (Brown 1993; 2002[b]). “Studies using surveys and questionnaires often use categories that the investigator imposes on the responses. Q, on the other hand, determines categories that are
operant” (Smith 2001). A crucial premise of Q is that subjectivity is communicable, because only when subjectivity is communicated, when it is expressed operantly, it can be systematically analysed, just as any other behaviour (Stephenson 1953; 1968).
The results of a Q methodological study can be used to describe a population of viewpoints and not, like in R, a population of people (Risdon et al. 2003). In this way, Q can be very helpful in exploring tastes, preferences, sentiments, motives and goals, the part of personality that is of great influence on behaviour but that often remains largely unexplored. Another considerable difference between Q and R is that “Q does not need large numbers of subjects as does R, for it can reveal a characteristic independently of the distribution of that characteristic relative to other characteristics.o.
References.
Exel Job van ,Graaf Gjalt de, 2005 , – Q Methodology/ A sneak PreviewErasmus MC, Institute for Medical Technology Assessment (iMTA),Vrije Universiteit, Dept. of Public Administration & Organisation Science, Faculty of Social Sciences.
Brown Robert, 1996, – Q Methodology and Qualitative ResearchQualitative Health Research,
Campbell, T.C.1995, – Investigating structures underlying relationships when variables are not thefocus: Q – technique and other techniques, paper presented at the Annual Meeting of theAmerican Educational Research Association, San Francisco,
Kramer, B., Hegedus, P., Gravina, V. 2003- Evaluating a Dairy Herd Improvement Project in Uruguayto Test and Explain Q Methodology, Proceedings of the 19th Annual Conference Raleigh, NorthCarolina, USA, , p. 347
Kufeld, C. – A Q –methodological study investigating the identity self – descriptions of a group ofex- smokers, Dissertation Research Project, University of Luton, p. 19