2.5.2 Constructing experts’ distribution functions
Course subject(s)
Module 2. Calibration and Information score
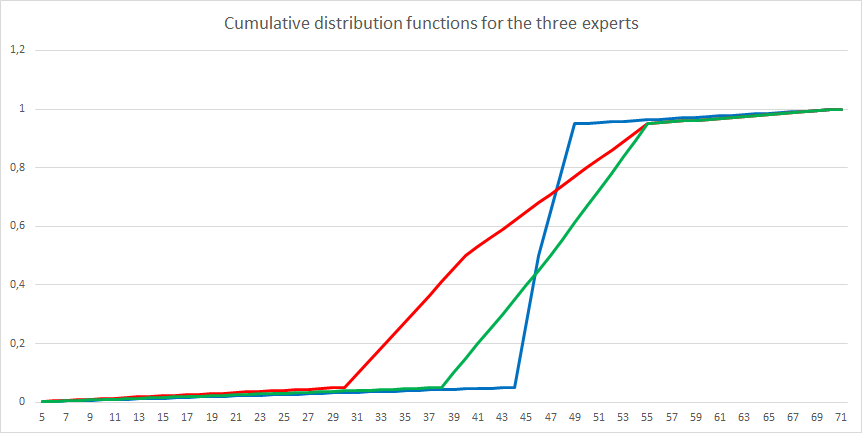
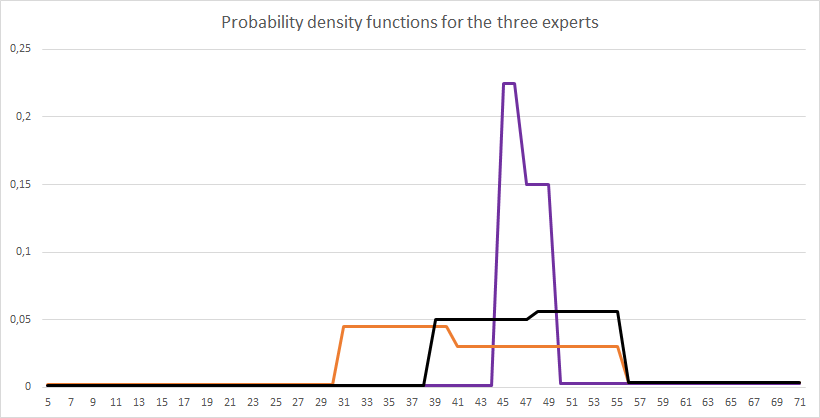
Consider the first question in the example of the Dutch supermarket used in beforehand. Below, you see the assessments of the 3 experts.
| Question | Realization | Expert 1
5% 50% 95% |
Expert 2
5% 50% 95% |
Expert 3
5% 50% 95% |
|---|---|---|---|---|
| 1 | 50 | 44 46 49 | 30 40 55 | 38 47 55 |
Using this table, we will now practice with the definition of a distribution function. The plot below shows the cumulative distribution functions of the 3 experts for question 1.

Consider now the probability density functions (pdf’s) of the three experts for question 1.


Decision Making Under Uncertainty: Introduction to Structured Expert Judgment by TU Delft OpenCourseWare is licensed under a Creative Commons Attribution-NonCommercial-ShareAlike 4.0 International License.
Based on a work at https://online-learning.tudelft.nl/courses/decision-making-under-uncertainty-introduction-to-structured-expert-judgment//.


